Curve_One was a photography and science project launched on June 26, 2010. The goal was simple: photograph the curvature of the earth and the blackness of space in a safe and legal manner.
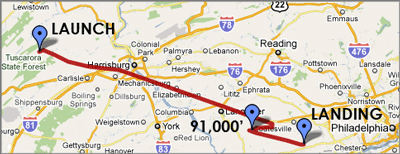
I anticipated reaching an altitude of 91,000 feet, but ultimately it rose to approximately 93,032 feet. Keep scrolling to read about the whole journey, or jump straight to the photo gallery to view the images.
$100 PRIZE to the first person who can provide me with a revised code that works with the currently designed system.
Concept and Research
Curve_One was insipred by Project Icarus, launched by students from MIT, and allowed me to test my engineering skills. Their results were the catalyst, but having an interest in photography, space, and engineering was what kept the project going month after month.
Research Process:
I began by reviewing The Code of Federal Regulations, Title 14--Aeronautics and Space--Part 101 which pertains to unmanned free balloons. In accordance with §101.1, most of the requirements would not be applicable because the payload would be less than 4 pounds. However, the regulations were reviewed and integrated into the design and launch process where applicable. §101.27 is useful because it discusses the information that needs to be provided to Air Traffic Control 6-24 hours in advance of the launch. The Aeronautical Information Manual was also reviewed early in the project to gain a basic understanding of restricted air space classifications (which was then useful later in life when I pursued my commercial drone pilots license.)
The National Weather Service launches sounding balloons and meteorological equipment twice a day from numerous locations throughout the country, so understanding their system was also a good starting point. The Federal Meteorological Handbook No. 3 (Rawinsonde and Pibal Observations) explained their typical setup and ascent rates. The Aerographer's Mate was useful for understanding how to tie-off the balloon.
The balloon and payload would be going to the Stratosphere, where it can be colder than -70°F, so insulated containers and thermal resistance were reviewed. Although I did start to review thermal properties of materials, I reasoned that a simple Styrofoam packing container can keep a block of dry ice from melting, so it was assumed that the container could just as easily keep cold out to protect the equipment. Battery performance vs. temperature was reviewed and it was determined that alkaline batteries could stop functioning in extreme temperatures and that lithium batteries would perform well even in colder temperatures. Lithium batteries are also significantly lighter and long lasting, making them an excellent power source for the project.
Rope knots were researched to help ensure that the various tied components would withstand the jostling from wind, balloon lift, parachute loading, etc. Some information was obtained from the International Guild of Knot Tyers to understand what type of knot would be appropriate.
Other projects and hobby ballooning organizations were also reviewed for concepts, pitfalls, etc. Below are the projects that were reviewed:
Edge of Space Sciences: A great FAQ section that answers loads of questions
Near Space Ventures: An organized group of launchers with a good ascent rate calculator
Bear: A very technical group with exceptional results
Sable 1: Experienced issues to avoid
UX-1: UK launch from 2005 with general information
Parallax Inc: A book worth of knowledge
HALO: Reaffirmed the University of Wyoming wind model
Pacific Start II: I actually didn't see this one until after the launch of Curve_One launch, but it's such an inspiring project that I list it here.
Curve_One Setup
Components were chosen based on weight, availability, price, and effectiveness.
 Camera: Needed to run off AA batteries or have a means of supplying light-weight external power. Needed to have an intervalometer function for taking photos at specified intervals. A Canon PowerShot A590IS was selected because it fit within budget, was within the minimum image quality specifications, it's light weight, easy to find on Ebay, and can be modified using the Canon Hack Development Kit (CHDK) to add the intervalometer feature. At $99, it seemed like a good deal. Using an 8GB memory card, this 8 megapixel camera would allow photos to be taken every 8 seconds with storage space to spare. One downside was that I couldn't access the intervalometer function and then turn off the LCD screen, which needed to be off to conserve battery life; I had to turn off the LCD and then navigate through the menus blindly to turn on the intervalometer.
 GPS: A Motorola i290 boost mobile cell phone, purchased from Ebay for $14.99, was used as the GPS tracking device. It too was inexpensive, lightweight, and was easily available. Installing a program onto the phone allowing the GPS location to be tracked via InstaMapper.com. Power was supplemented for the phone using an Energizer AA cell phone charger purchased for $14.67. Note: Although a phone was used as the tracking method for Curve_One, I recommend using something more powerful to help aid in the tracking and recovery of the payload; cell phones are inexpensive and relatively reliable, but they're a lot less reliable than a true GPS tracking/reporting device and they also provide very limited flight data. Most importantly, if it lands in an area without cell phone coverage, you likely won't recover it.
The camera and phone were attached to a bicycle and driven around Philadelphia. Next tests were done while driving from Philadelphia to Pittsburgh. Both components worked for many hours longer than was necessary and the GPS accuracy was remarkable.
 Payload: A small, strong, 1-1/4" Styrofoam container was donated... Cost: Free! After identifying the positions of the camera, phone and charger, a hole was cut through the container wall for the lens. Next a piece of packing insulation from a frozen shipped parcel was recycled; it was cut to fit tightly within the payload while still accommodating the components. Specific care was taken to cut away areas of foam that would depress buttons on the phone or camera, but would still secure them from jostling during flight.
Balloon: A 500 gram meteorological sounding balloon was purchased for $45.00. The 500 gram was chosen based on payload weight and desired elevation. The balloon would be filled to approximately 5.3-feet in diameter to achieve the desired ascent rate.
 Helium: 80 cu.ft of helium was purchased from AirGas for around $38; the utilized volume of helium was less than 80 cu. ft, but this was the closest size to the required amount. The quantity of helium was identified based on the payload weight and anticipated ascent rate. This was one of the most complex and important components of the project and should not be overlooked. Given the known weights of the setup components, and given a specified ascent rate, the amount of helium required to provide sufficient "free lift" was computed using the Ideal Gas Law (PV=nRT.)
Parachute: A parachute with a weather balloon attachment was purchased from Spherachutes for $24. It was manufactured 'to order' with alternating neon orange and white colors for high visibility. The weather balloon attachment allows the top of the parachute to be connected to another rope that runs up to the balloon. The parachute was tested by dropping it fully loaded off a tall building, verifying that the components were intact, and that observers on the ground didn't perceive the decent rate as a threat.
Wind Model
"Where is this balloon going to go?"
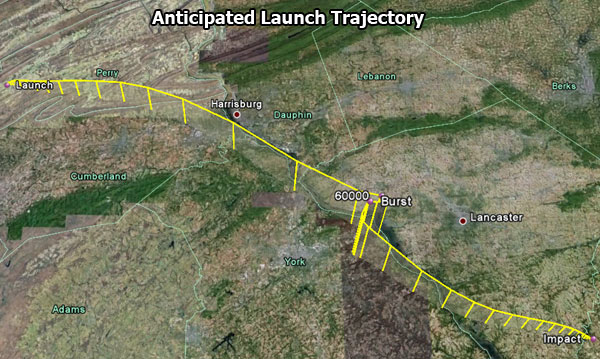
Wind modeling was done using the University of Wyoming, Department of Atmospheric Science, Balloon Trajectory Forecast. The modeler exports a three-dimensional Google Earth KML file or a text file, so the anticipated trajectory was easily modeled. Data from the National Center for Atmospheric Research was used to check the accuracy of the trajectory model and as a better tool for visualizing the wind patterns.
The distance the balloon would travel, and where a good launch and landing location might be located, was something that needed to be identified early in the process. Two test-launch locations, dubbed "Northside" and "Tussey," were selected based because they were a reasonable driving distance from home, and a reasonable distance from restricted air space. These locations were modeled almost daily from 12/12/09 to 05/13/10 at 12 o'clock zulu (7AM EST/8AM EDT.) Click on the images below to download the Google Earth kmz files used to create the images.

Although it had a few acceptable trajectories, Northside often infringed upon restricted airspace in Philadelphia, Atlantic City, and New York; crashed into the ocean numerous times; and was clearly too close to home. Not an ideal launch location.

Tussey frequently stayed away from urban areas except when the wind patterns blew towards the south. Having done this exercise, I understood approximately how far the balloon would travel on a given day based on the wind speeds and direction.

Before looking for a good set of launch locations, I first wanted to identify a few safe landing areas; typically 10 square mile patches of rural area. Eventually I found a 20 by 30 mile area away from airports, restricted air space, and heavily populated areas. Knowing this potential landing area, and knowing about how far the balloon would travel, I panned around Google Earth looking for rural athletic fields and open park spaces in the area where launch might be possible. This provided an excellent sample of potential launch locations that could suit different wind patterns and speeds on the day of the launch.
As the launch date approached, I began modeling the trajectory 84 hours before the launch and began to select the anticipated launch location(s). As the model became more refined closer to launch, the actual launch location was selected.
Launch
Curve_One was originally scheduled for launch on May 16th, 2010. Although suitable launch locations were available for the predicted wind model, overcast clouds were forecast and the launch had to be scrubbed; it was rescheduled for June 26th. Wind forecasts were consistent in the days leading up to the June launch and acceptable cloud cover was forecast. 14 hours prior to launch, the Harrisburg Air Traffic Control tower was notified of the launch. They were provided the requisite launch, trajectory, ascent, and landing information and they asked to be notified again one hour prior to launch.
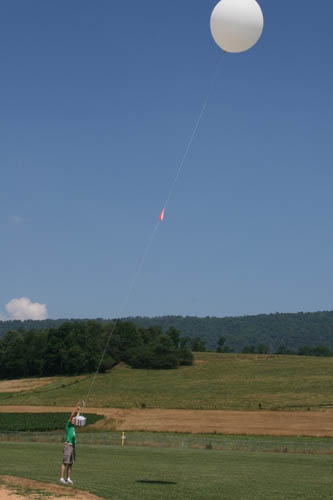
The launch crew (Me, Brad, and Erika) drove 150 miles from Philadelphia to Blain, PA. We then followed the Curve_One launch manual. Note: The only step not utilized from the initial manual was the concept of using a 16.5' rope loop to check the balloon diameter. There was reasonable concern that a rope would puncture the balloon, so instead a tape measure was held a reasonable distance from the balloon and the general diameter was estimated. A known weight was tied onto the balloon in an attempt to verify that the anticipated free lift would be achieved; during this test the balloon 'pretty much' balanced.
The ascent was in the anticipated direction and appeared to rise at an acceptable rate. After watching it rise for a minute, the helium tank and launch tools were loaded into the chase vehicle. We could still see Curve_One as we pulled away approximately 10 minutes later.
The flight path was anticipated to take Curve_One towards Harrisburg, along the Susquehanna River, landing Southeast of Lancaster. The flight time was anticipated to be 2hr 14min and would cover a distance of 82 miles.
We proceeded towards the anticipated landing location with an iphone and palm pre attempting to track the payload trajectory. Data services were spotty while driving, but we eventually got a few blips from the initial launch. We lost contact very quickly, which was expected, so we focused on driving to the general landing area. 2hr 14min came and went. 2hr 25min, stopped at a roadside Amish farm stand and bought honey, black raspberry pie, jam, and corn on the cob for a hopefully celebratory dinner. 2hr 35 minutes, still nothing. We were getting hungry. We stopped at a local diner and grabbed food while mashing the refresh buttons on the cell phones. Battery power was dwindling, lunch was finished, ice cream was being served... when blip, blip, blip the payload appeared 16 miles away.
The payload had landed at the University of Pennsylvania's horse stable/hospital. After the short drive, we arrived to find an undisturbed, still functioning, payload, exactly where the GPS said it was. No dents, no bruises, no injuries, no passage through restricted air space. Beautiful. I opened the payload, turned the camera off, loaded the SD into the laptop, and then rejoiced.
Analysis of the Data
There were a lot of questions to answer. Where? How high? How accurate? Where was the camera pointing during each photo? I thought I was going to hit 91,000'... did I hit that mark?
The GPS data retrieved from instamapper was essentially useless for modeling the trajectory. The only other available data was the photographs, so photogrammetry was utilized to identify the camera location. This was done by identifying distinguishable locations in the photographs and locating them in Google Earth. X,Y, and Z coordinates for those distinguishable locations were obtained from Google Earth and the distances between those points were calculated. Next, the distances between the points were measured on each photograph. Given enough points, the comparative distances between the different data sources, the height, location, and camera tilt were then obtained.
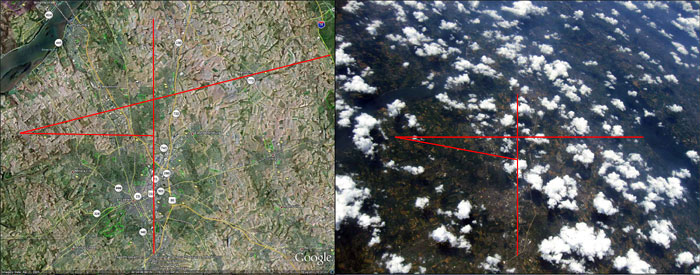
Above is a side-by-side comparison of point analysis in Google Earth and on the photograph.
(Note: More points than just the shown few were actually utilized for the photographic model.)
In all, 16 photographs were analyzed in detail to map the travel time, trajectory and elevation. The total flight time was 2hr 57mins 39sec based on the time stamp on the photographs, or 43 minutes longer than anticipated. Based on the data obtained from the photos, the balloon burst 2hr 27min 28sec into the flight at an elevation of 93,032 feet. As depicted below, burst occurred 25 miles East of the predicted location, 59 minutes later than anticipated, and 9,518 feet higher than calculated.
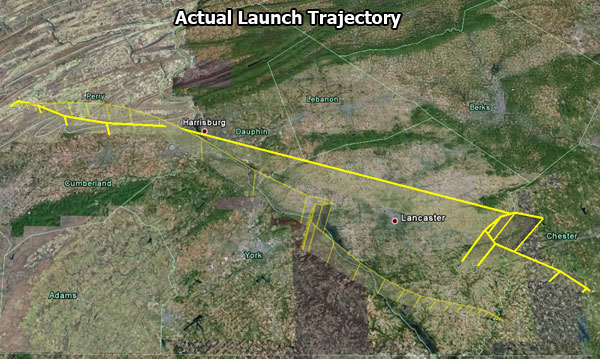
Above is a depiction of the actual trajectory vs. the "lighter" predicted trajectory. Clicking the image will download the google earth kml file for both trajectories.

The image above was roughly stitched together as an aid when trying to identify photo orientations. Left is looking Northwest towards Lancaster, off-center right is looking Southeast towards the Chesapeake Bay, and the right portion is again looking towards the Northwest. The image itself is rough, but was a good quick reference tool.
Conclusions
What happened?
The balloon landed 15 miles from the anticipated landing location, the flight took longer than anticipated, the camera had condensation problems, the GPS barely worked, and hundreds of clear images were captured and recovered.
I attribute the differences between the model and the actual Curve_One flight to the intertwined calculations of ascent rate, free lift, inflation size, the effects of humidity's drag force, and trying to balance a weighted balloon in an open field. As a result, the balloon was likely underinflated resulting in a slower ascent rate. As a result, the ascent took longer, swept further East before reaching burst altitude, and achieved a higher elevation.
The descent rate was also faster than the shown model, but I always believed that the payload would drop faster during the initial decent than what the University model showed. The model doesn't seem to show that the payload would free-fall without the parachute opening for quite a while. This is because there isn't enough air pressure at higher altitudes to actually open the 'chute.
The lens had serious condensation problems on the ascent and decent; however, a sufficient number of clear photos were obtained to consider the 'mission' a success. For future launches I believe the heat packs should be removed and the payload better sealed.
The GPS phone provided information for the first minute of flight and the landing location. Nothing else was reported. All future flights will include a GPS tracking device with better transmission of data and reporting capabilities. The phone was a cheap source of tracking, but real-time tracking would be more revealing and would cut down on photo analysis time.
While I did learned some of the necessary principles of this launch during my civil engineering studies at Drexel University, I do not claim to be an expert in many of the topics associated with the what's, why's, and how's of this launch. I did sufficient research and identified accepted practices and procedures to feel comfortable that this launch would not harm someone. If you are considering a launch, I recommend having a good level of confidence in your setup and procedure, and an understanding of how the experiment works.
I also do not claim to be an expert in photogeometric analysis, but am comfortable presenting my analysis of the data with the understanding that there is some margin of error in my altitude calculations.
This was a rewarding experience. I enjoyed the time spent researching various fields of study that were unfamiliar to me, and refreshing my memory on a few basic principles that I'd used in college. Some of the most helpful were:
- Understanding UTC "zulu" time vs Eastern Standard/Daylight Savings
- Solving Simultaneous Equations
- Reading Wind Maps
- The Ideal Gas Law
- Canon CHDK scripting
- Converting (and documenting) Unit Conversions
The photos are pretty cool (if I do say so myself) and putting a 'mission' spin on the project made it more enjoyable. Future flights will occur, and they will utilize the skills and lessons learned during this project.
Now head on over to the photos.